


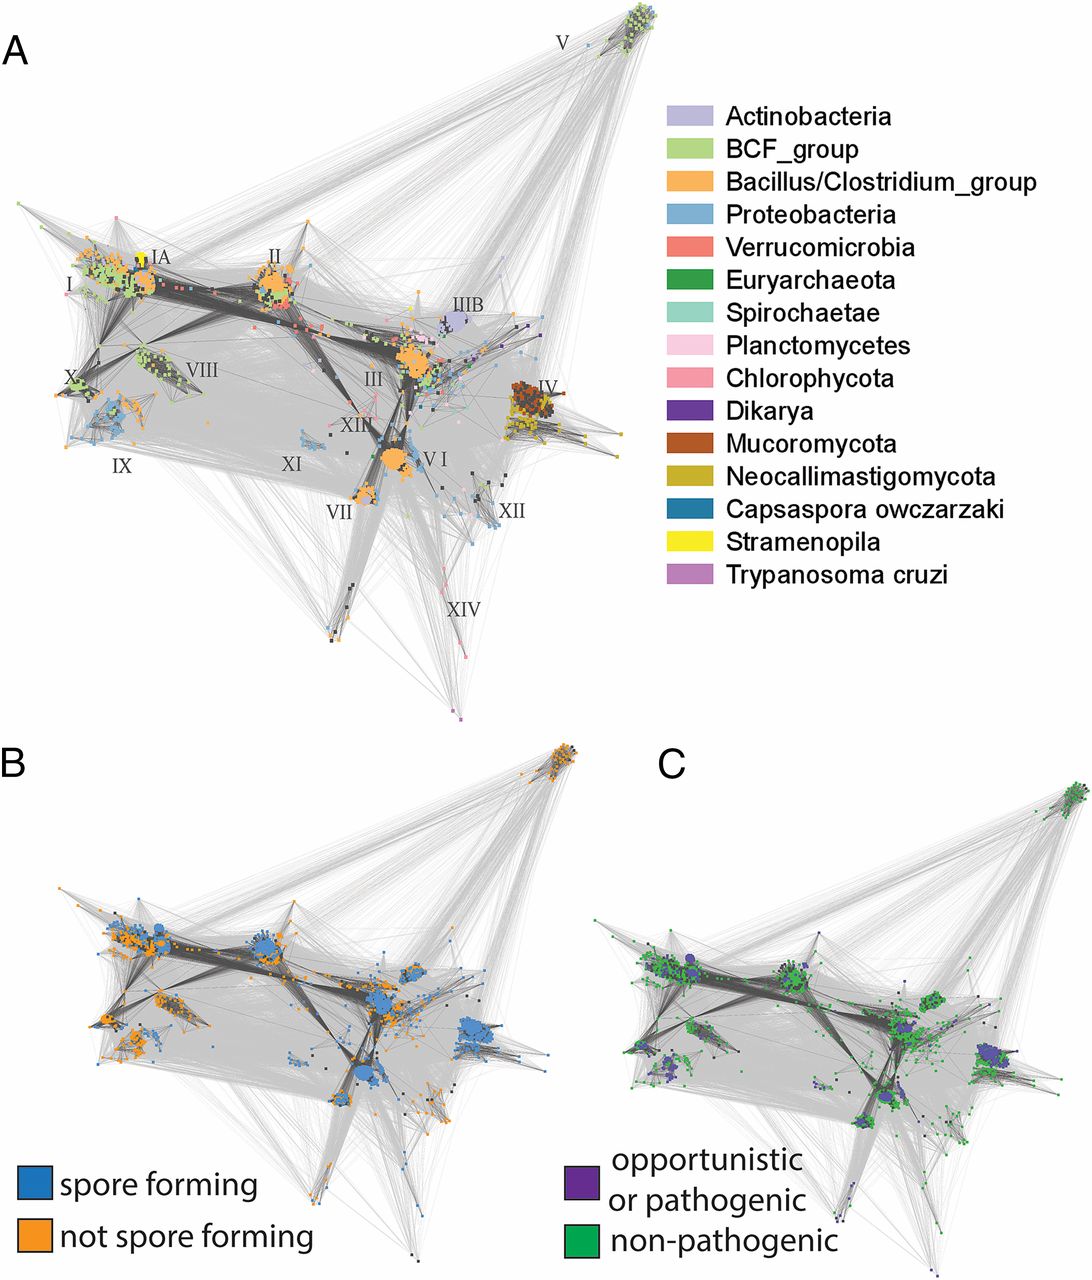
Fig. 7.
Taxonomy, sporulation, and pathogenicity of CotH-possessing organisms. (A) CLANS clustering analysis of CotH homologs represented graphically by the network of BLAST-derived sequence similarities (edges) between representative CotH proteins (dots). Clusters are colored by taxonomy. Roman numerals denote sequence clusters (representatives in the alignment are shown in Fig. S2). CLANS clustering analysis of CotH homologs is colored by ability to sporulate (B) or by pathogenicity (C).

