
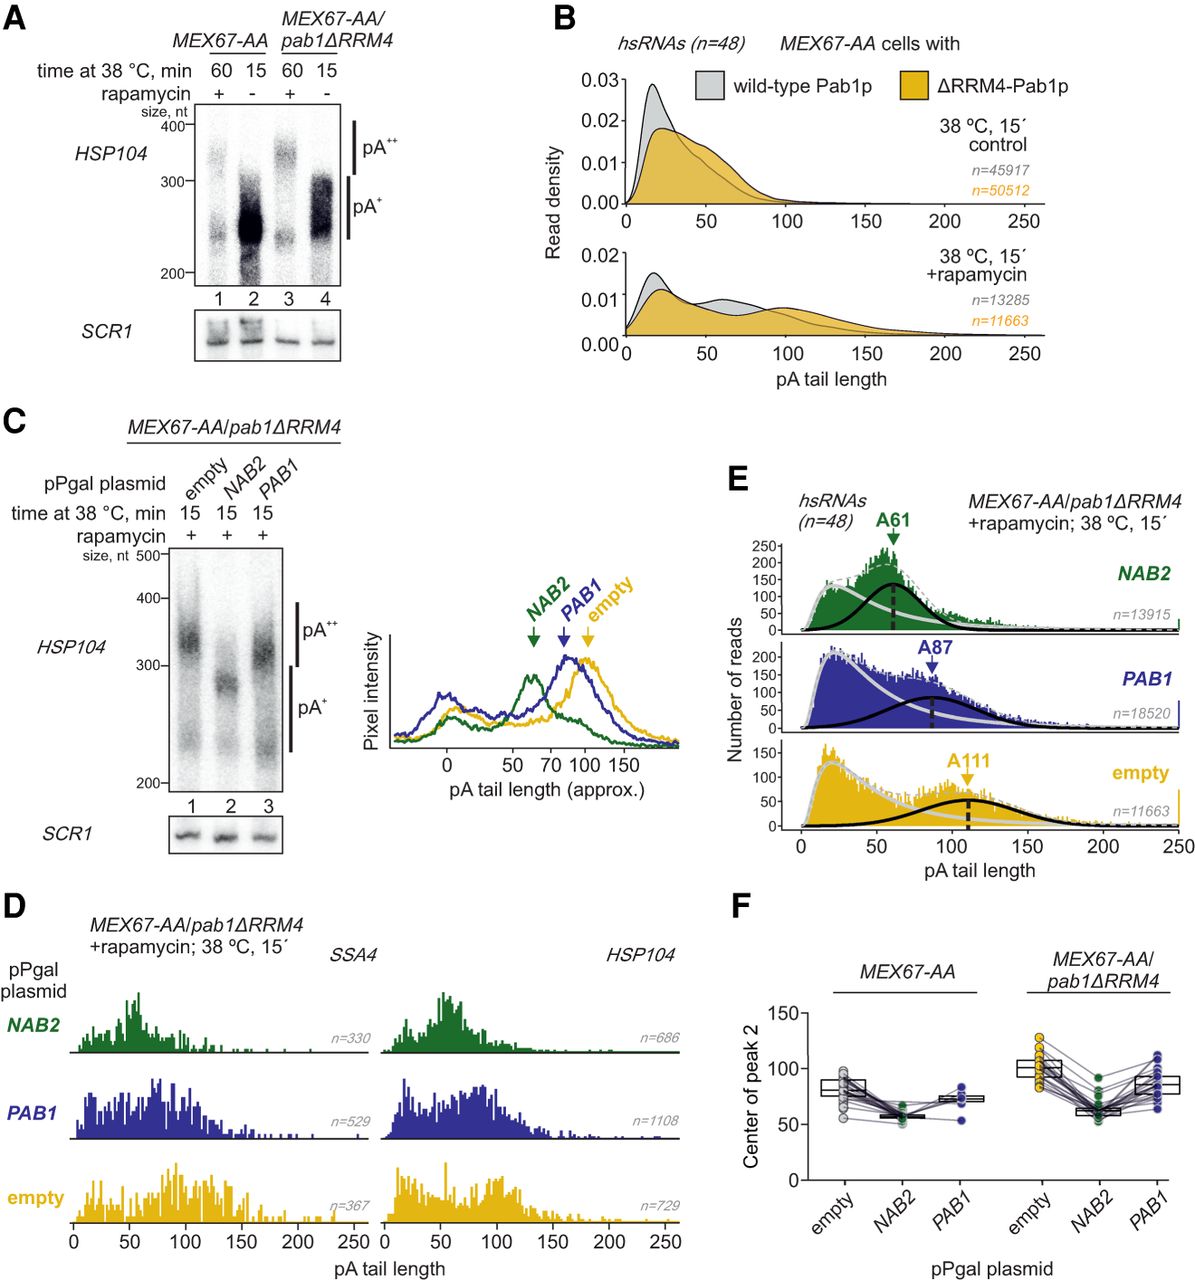
Nab2p-independent mechanisms for terminating nuclear polyadenylation. (A) RNase H/Northern blot analysis of HSP104 RNA 3′ ends as in Figure 1B, but for MEX67-AA and MEX67-AA/pab1ΔRRM4 cells with or without nuclear depletion of Mex67p as indicated. (B) DRS-derived pA tail length distributions of hsRNAs (n = 48) from MEX67-AA (gray density) or MEX67-AA/pab1ΔRRM4 (yellow density) cells. Individual transcript examples are shown in Supplemental Figure S2B. (C) RNase H/Northern analysis of HSP104 RNA 3′ ends as in Figure 1B, but for MEX67-AA/pab1ΔRRM4 cells expressing endogenous levels of PABPs (pPgal “empty”) or overexpressing Nab2p or Pab1p from plasmid-borne copies (pPgal-NAB2 or pPgal-PAB1) (Supplemental Fig. S2D). Phosphorimager lane scans are shown at the right with arrows marking the main RNA pA tail length peaks of different samples. (D,E) DRS-derived pA tail length distributions of SSA4 and HSP104 RNAs (D) or of hsRNAs (n = 48; E) displaying individual reads for the samples described in C, with bimodal distributions fitted as detailed in Supplemental Figure S2F. Peak centers of the long pA tail distributions (black lines) are reported. Note that the larger variance of the DRS estimates for the long pA tails flatten their distribution compared with the short pA tails. (F) Quantification of DRS long pA tail distribution centers among individual heat-induced transcripts (connected dots) in rapamycin-treated samples. Box plot displays mean ± SD of plotted values.


