
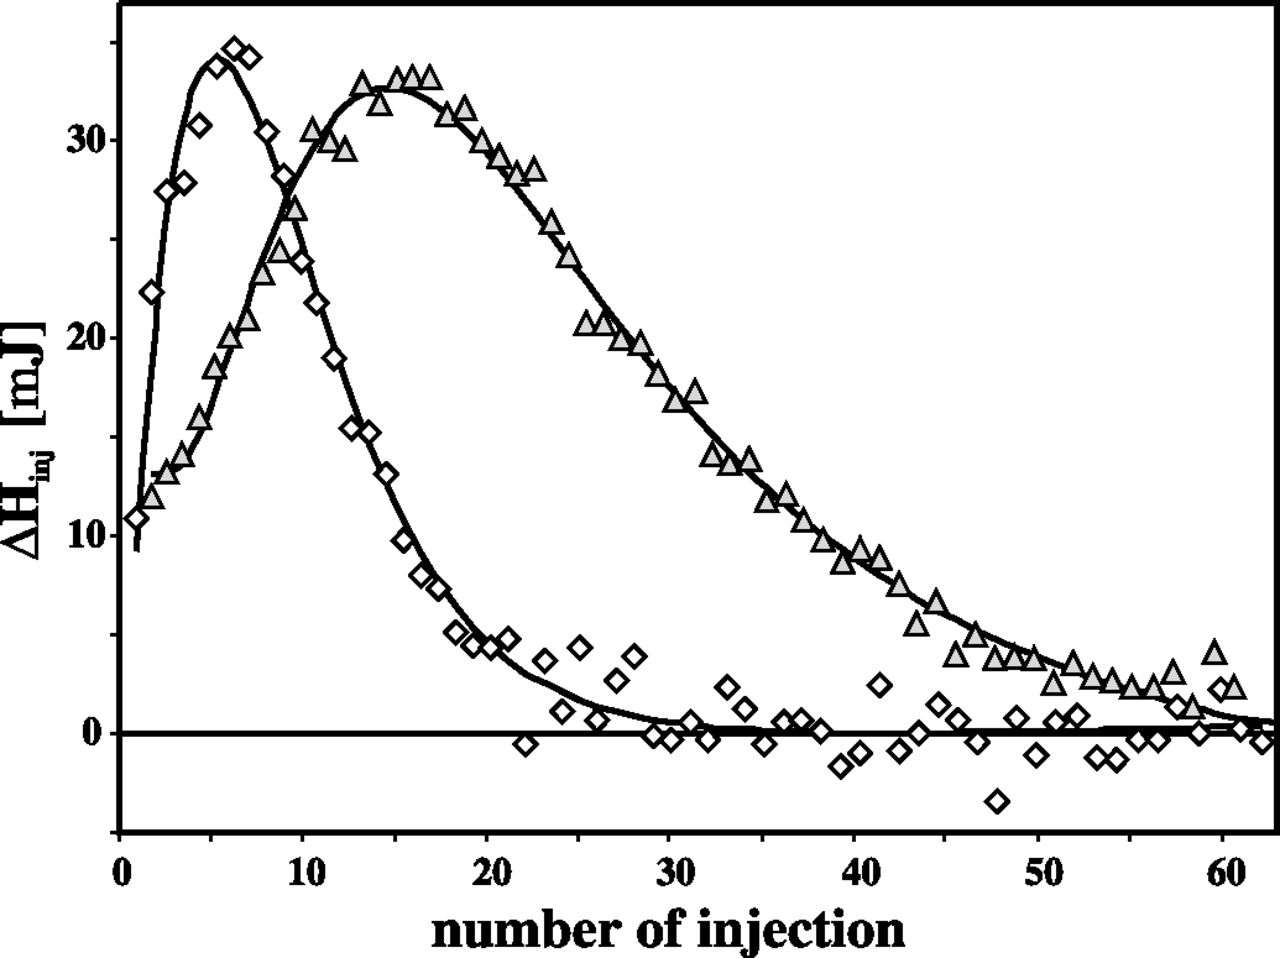
FIGURE 2.
Comparison of calorimetric profiles recorded for S100A1 and S100A1-NO. Shown are ITC titrations of S100A1 (triangles) and S100A1-NO (diamonds) protein solutions (40 μm) in TES buffer, pH 7.4, containing 150 mm NaCl. Solid lines represent fitted models (see Table 2 for thermodynamic parameters of Ca2+ binding).


