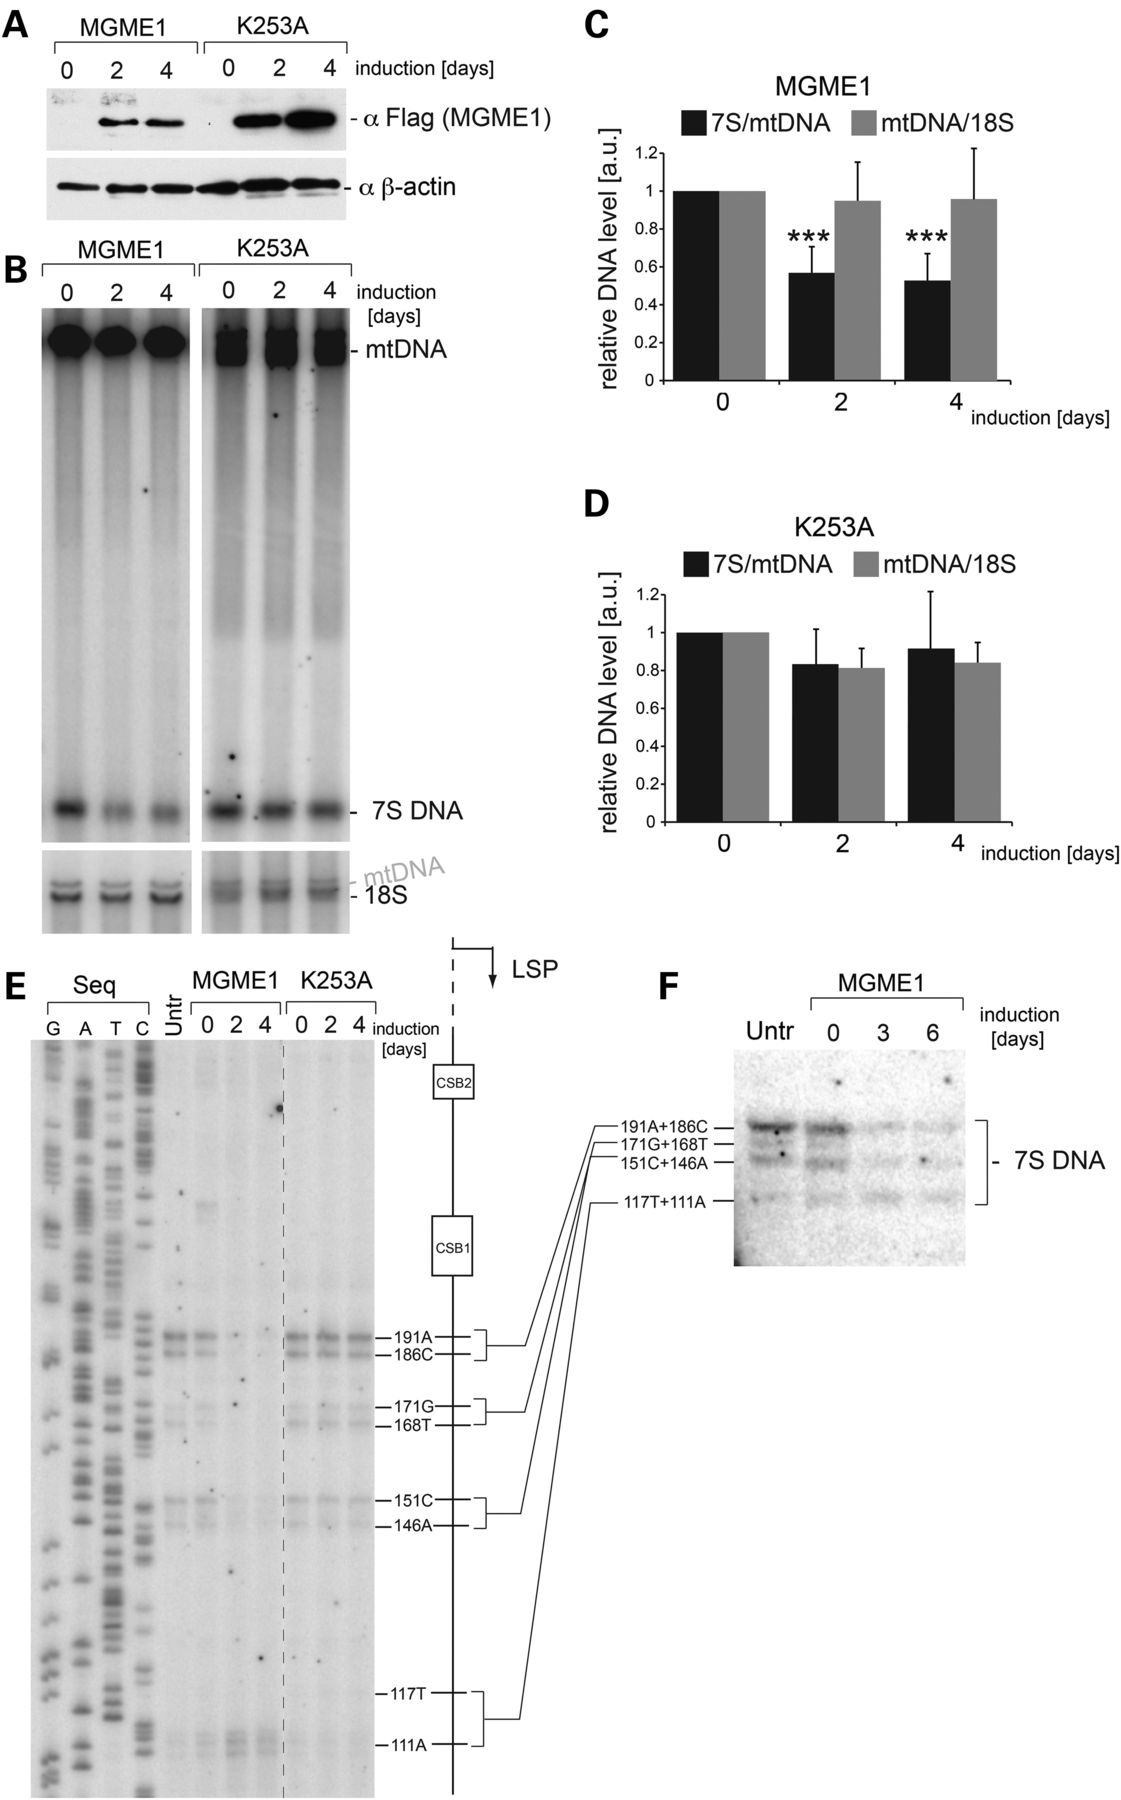
Overexpression of MGME1 modifies the steady-state levels and length of 7S DNA. (A) Western blot of a time course of expression of MGME1.Flag.Strep2 or the K253A mutant in HEK293T cells. The MGME1 protein was detected using anti-Flag antibodies; β-actin used as a loading control. (B) Total DNA from cells expressing MGME1 wild-type or the K253A catalytic mutant in a 4-day time course was analysed by 1D Southern blotting with a probe specific for the NCR (mtDNA region: 14 258–4121). 18S rDNA was used as a loading control. (C) and (D) Quantification of the Southern blots as per (A) for MGME1 wild-type (B) or K253A (C). The values of the relative DNA level (7S DNA/mtDNA—black or mtDNA/18S rDNA—grey) were normalized for the values obtained for uninduced cells. ***P < 0.001; two-tailed Student's t-test; n = 7 for MGME1 wt, n = 3 for K253A, error bars = 1 SD. (E) Mapping of DNA 5′ ends in the human mtDNA NCR of HEK293T cells expressing MGME1 wild-type or K253A in a 4-day time course. PEx was performed as per Figure 1C. (F) Total DNA from cells expressing MGME1 wild-type in a 6-day time course was analysed using a high-resolution (4% denaturing polyacrylamide gel) 1D Southern blot with a probe as per (A). The 7S DNA species containing the DNA 5′ ends mapped by PEx in (D) are indicated. ‘Untr’—non-transfected control.


